**PLEASE SCROLL DOWN FOR THE ENGLISH VERSION**
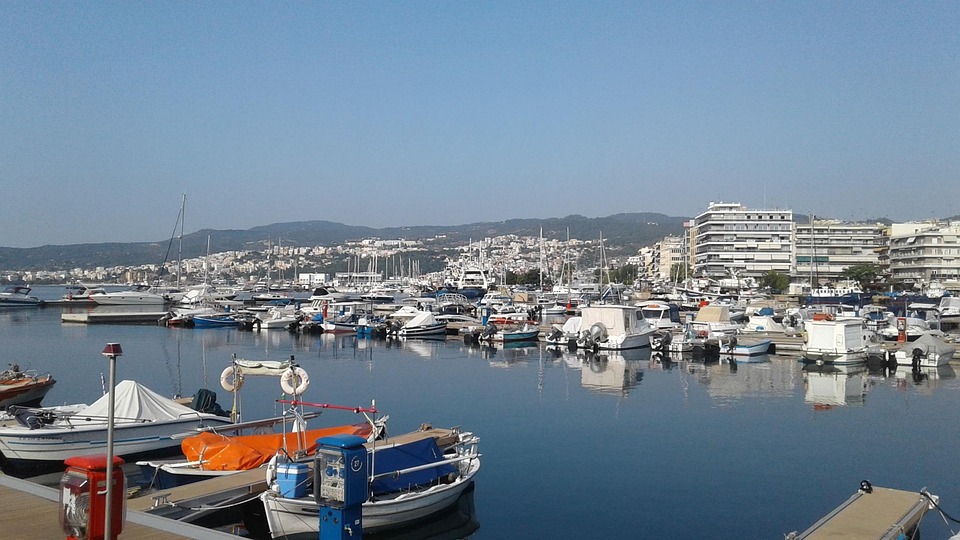
Η τελευταία ανάλυση της αγοράς από την eXp Realty Greece έδειξε ότι ορισμένες από τις πιο προσιτές αγορές της Ελλάδας για επενδυτές της Χρυσής Βίζας είναι αυτές που κατέγραψαν μερικά από τα υψηλότερα ποσοστά αύξησης των τιμών των κατοικιών τον τελευταίο χρόνο, με την Καβάλα να παρουσιάζει τη μεγαλύτερη αύξηση κατά 33,7%.
Η eXp Greece ανέλυσε τα πιο πρόσφατα δεδομένα τιμών κατοικιών από τον Spitogato, εξετάζοντας τον ρυθμό αύξησης που παρατηρήθηκε το 4ο τρίμηνο του 2024 σε σύγκριση με το 4ο τρίμηνο του 2023.
Η έρευνα δείχνει ότι η Καβάλα κατέγραψε την πιο απότομη αύξηση στις αξίες των ακινήτων, με άνοδο 33,7% μόνο τον τελευταίο χρόνο.
Η Μεσσηνία παρουσίασε επίσης σημαντική αύξηση κατά 18,2%, μαζί με τα Χανιά στο 16,2%.
Και οι τρεις αυτές τοποθεσίες είναι επίσης από τις πιο προσιτές όσον αφορά την απόκτηση ελληνικής κατοικίας μέσω επένδυσης.
Η Ελλάδα είναι μία από τις πιο δημοφιλείς χώρες για τη Χρυσή Βίζα παγκοσμίως, και όσον αφορά το ελάχιστο ποσό επένδυσης που απαιτείται για τη χορήγηση κατοικίας, λειτουργεί με ένα σύστημα τριών επιπέδων.
Το Επίπεδο Α αφορά τις πιο δημοφιλείς περιοχές της Ελλάδας, όπως η Αθήνα, η Θεσσαλονίκη και τα νησιά, όπου το ελάχιστο ποσό επένδυσης που απαιτείται σε αυτές τις τοποθεσίες είναι 800.000 ευρώ (περίπου 867.000 δολάρια), ενώ όλες οι άλλες περιοχές, γνωστές ως Επίπεδο Β, απαιτούν ελάχιστη επένδυση 400.000 ευρώ (περίπου 435.000 δολάρια).
Άλλες περιοχές του Επιπέδου Β όπου οι τιμές των κατοικιών φαίνεται να έχουν ωφεληθεί από τους επενδυτές της Χρυσής Βίζας περιλαμβάνουν τη Λακωνία (+15,5%), τα Γρεβενά (+14,8%) και τη Χαλκιδική (+14%), οι οποίες όλες κατατάσσονται στις 10 κορυφαίες περιοχές με τη μεγαλύτερη αύξηση στις αξίες των ακινήτων τον τελευταίο χρόνο.
Ωστόσο, υπάρχουν τέσσερις περιοχές του Επιπέδου Α της ελληνικής αγοράς ακινήτων που επίσης βρίσκονται στις 10 κορυφαίες, υποδηλώνοντας ότι η αγορά επηρεάζεται από επενδυτές σε όλα τα επίπεδα. Ο υψηλότερος ρυθμός αύξησης παρατηρήθηκε στον Πειραιά κατά 15,6%, με τη Λευκάδα και τις Σποράδες να βρίσκονται επίσης στις 10 κορυφαίες με 13,1% και 12,8% αντίστοιχα.
Greece house price by areas and RBI thresholds : Data tables
| 1 | ||||||
|---|---|---|---|---|---|---|
| 2 | Data tables | |||||
| 3 | Tiered investment information sourced from GoldenVisas.gr | |||||
| 4 | Average property price Q4 2023 and Q4 2024 sourced from Spitogratos | |||||
| 5 | ||||||
| 6 | Table shows annual price change % (Q4 2024 — Q4 2024) in different areas of Greece, the average property price in each area based on an average property size of 120sqm, and the minumum Residency by Investment (RBI) requirement for each location. | |||||
| 7 | Area | Q4 2023 (€/sqm) | Q4 2024 (€/sqm) | Annual change % | Est RBI investment threshold | |
| 8 | Kavala Prefecture | € 1,360 | € 1,818 | 33.7% | € 400,000 | |
| 9 | Messinia | € 1,563 | € 1,848 | 18.2% | € 400,000 | |
| 10 | Chania Prefecture | € 2,190 | € 2,545 | 16.2% | € 400,000 | |
| 11 | Piraeus | € 2,174 | € 2,513 | 15.6% | € 800,000 | |
| 12 | Lakonia | € 1,154 | € 1,333 | 15.5% | € 400,000 | |
| 13 | Chios Prefecture | € 1,250 | € 1,435 | 14.8% | € 800,000 | |
| 14 | Grevena | € 670 | € 769 | 14.8% | € 400,000 | |
| 15 | Chalkidiki | € 2,193 | € 2,500 | 14.0% | € 400,000 | |
| 16 | Lefkada Prefecture | € 2,652 | € 3,000 | 13.1% | € 800,000 | |
| 17 | Sporades | € 2,143 | € 2,418 | 12.8% | € 800,000 | |
| 18 | Achaia | € 1,182 | € 1,330 | 12.5% | € 400,000 | |
| 19 | Argolis | € 1,695 | € 1,905 | 12.4% | € 400,000 | |
| 20 | Athens – East | € 2,000 | € 2,244 | 12.2% | € 800,000 | |
| 21 | Pella | € 776 | € 864 | 11.3% | € 400,000 | |
| 22 | Thessaloniki – Municipality | € 2,206 | € 2,452 | 11.2% | € 800,000 | |
| 23 | Athens – Center | € 2,037 | € 2,250 | 10.5% | € 800,000 | |
| 24 | Zakynthos | € 2,000 | € 2,206 | 10.3% | € 800,000 | |
| 25 | Xanthi Prefecture | € 1,000 | € 1,096 | 9.6% | € 400,000 | |
| 26 | Rodopi Prefecture | € 952 | € 1,033 | 8.5% | € 400,000 | |
| 27 | Karditsa Prefecture | € 615 | € 667 | 8.5% | € 400,000 | |
| 28 | Florina Prefecture | € 625 | € 673 | 7.7% | € 400,000 | |
| 29 | Athens – North | € 2,950 | € 3,167 | 7.4% | € 800,000 | |
| 30 | Athens – South | € 3,636 | € 3,895 | 7.1% | € 800,000 | |
| 31 | Magnesia | € 1,168 | € 1,250 | 7.0% | € 400,000 | |
| 32 | Phocis | € 1,412 | € 1,506 | 6.7% | € 400,000 | |
| 33 | Heraklion Prefecture | € 1,525 | € 1,625 | 6.6% | € 400,000 | |
| 34 | Drama Prefecture | € 730 | € 777 | 6.4% | € 400,000 | |
| 35 | Cyclades | € 3,455 | € 3,676 | 6.4% | € 800,000 | |
| 36 | Kefalonia Prefecture | € 2,188 | € 2,318 | 5.9% | € 400,000 | |
| 37 | Evia | € 1,322 | € 1,400 | 5.9% | € 400,000 | |
| 38 | Dodecanese | € 1,803 | € 1,905 | 5.7% | € 800,000 | |
| 39 | Evros | € 1,412 | € 1,485 | 5.2% | € 400,000 | |
| 40 | Athens – West | € 1,875 | € 1,963 | 4.7% | € 800,000 | |
| 41 | Corinthia | € 1,500 | € 1,569 | 4.6% | € 400,000 | |
| 42 | Arta Prefecture | € 842 | € 880 | 4.5% | € 400,000 | |
| 43 | Rest of Attica | € 1,875 | € 1,951 | 4.1% | € 400,000 | |
| 44 | Arcadia | € 1,154 | € 1,200 | 4.0% | € 400,000 | |
| 45 | Serres Prefecture | € 833 | € 864 | 3.7% | € 400,000 | |
| 46 | Corfu Prefecture | € 2,100 | € 2,167 | 3.2% | € 400,000 | |
| 47 | Kilkis Prefecture | € 667 | € 687 | 3.0% | € 400,000 | |
| 48 | Ioannina Prefecture | € 1,452 | € 1,492 | 2.8% | € 400,000 | |
| 49 | Imathia | € 758 | € 773 | 2.0% | € 400,000 | |
| 50 | Samos Prefecture | € 917 | € 933 | 1.7% | € 400,000 | |
| 51 | Kozani Prefecture | € 639 | € 650 | 1.7% | € 400,000 | |
| 52 | Boeotia | € 1,250 | € 1,267 | 1.4% | € 400,000 | |
| 53 | Lesvos Prefecture | € 1,042 | € 1,054 | 1.2% | € 400,000 | |
| 54 | Aetolia & Acarnania | € 966 | € 977 | 1.1% | € 400,000 | |
| 55 | Pieria Prefecture | € 1,089 | € 1,100 | 1.0% | € 400,000 | |
| 56 | Larissa Prefecture | € 1,160 | € 1,169 | 0.8% | € 400,000 | |
| 57 | Preveza Prefecture | € 1,699 | € 1,705 | 0.4% | € 400,000 | |
| 58 | Rethymno Prefecture | € 1,813 | € 1,815 | 0.1% | € 400,000 | |
| 59 | Trikala Prefecture | € 1,000 | € 1,000 | 0.0% | € 400,000 | |
| 60 | Ilia | € 915 | € 905 | -1.1% | € 400,000 | |
| 61 | Phthiotis | € 1,080 | € 1,064 | -1.5% | € 400,000 | |
| 62 | Lasithi Prefecture | € 1,875 | € 1,815 | -3.2% | € 400,000 | |
| 63 | Thesprotia | € 1,395 | € 1,320 | -5.4% | € 400,000 | |
| 64 | Kastoria Prefecture | € 588 | € 551 | -6.3% | € 400,000 | |
| 65 | Evrytania | € 1,273 | € 1,025 | -19.5% | € 400,000 | |
Πίνακες δεδομένων και πηγές
*Πληροφορίες για τα επίπεδα επένδυσης προέρχονται από την Astons
Μέση τιμή ακινήτων το 4ο τρίμηνο 2023 και το 4ο τρίμηνο 2024 προέρχονται από το Spitogratos
The latest market analysis from eXp Realty Greece has shown that it’s some of Greece’s most accessible markets for Golden Visa investors that have seen some of the highest rates of house price growth over the last year, with Kavala seeing the largest increase at 33.7%.
eXp Greece analysed the latest house price data from Spitogatos* looking at the rate of growth seen in Q4 2024 versus Q4 2023.
The research shows that Kavala has seen the sharpest increase in property values, up by 33.7% in the last year alone.
Messinia has also seen a considerable increase at 18.2%, along with Chania at 16.2%.
All three locations are also some of the most accessible when it comes to obtaining Greek residency by investment.
Greece is one of the world’s most popular Golden Visa nations, and when it comes to the minimum investment required for residency to be granted, it operates a three-tier system*.
Tier A concerns the most popular areas of Greece, such as Athens, Thessaloniki, and the Islands, and the minimum investment required in these locations is €800,000 (approx. $867,000), while all other areas, known as Tier B, require a minimum investment of €400,000 (approx. $435,000).
Other Tier B areas where house prices appear to have benefitted from Golden Visa investors include Lakonia (+15.5%), Grevena (+14.8%) and Chalkidiki (+14%), all of which rank in the top 10 areas to have seen the highest increase in property values over the last year.
However, there are four Tier A areas of the Greek property market that also feature within the top 10, suggesting that the market is being influenced by investors at all levels.
The highest rate of growth has been seen across Piraeus at 15.6%, with Lefkada and Sporades also making the top 10 at 13.1% and 12.8% respectively.
Data tables and sources
*Tiered investment information sourced from Astons
Average property price Q4 2023 and Q4 2024 sourced from Spitogatos